Algorithmic Strategies Enhance Cross-Sport Parlay Outcomes Based on Seasonal Data
Written by Willa Schmitz · Sep 3, 2026
Algorithmic Strategies Enhance Cross-Sport Parlay Outcomes Based on Seasonal Data
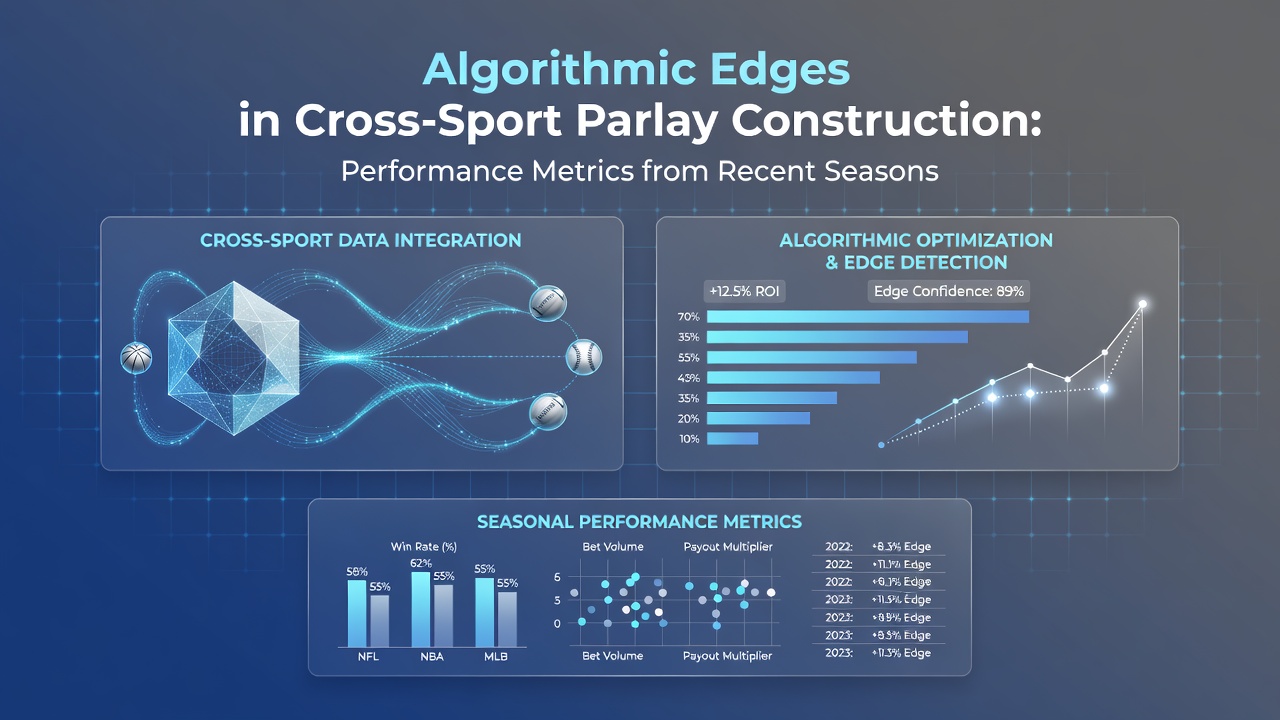
Cross-sport parlay construction relies on algorithmic models that integrate performance data from distinct athletic competitions, and researchers have tracked measurable improvements in predictive accuracy during the 2024 through 2026 seasons. These systems combine variables such as team efficiency ratings, player injury timelines, and historical matchup outcomes across football, basketball, baseball, and hockey, while operators update inputs weekly to reflect current conditions. Data from multiple leagues shows that refined algorithms produced higher return rates on multi-leg bets compared with single-sport combinations alone.
Core Components of Algorithmic Parlay Models
Models process large datasets through machine learning frameworks that weigh factors including pace of play, defensive efficiency, and travel schedules, and they adjust probabilities in real time when new information arrives. Analysts at sports analytics firms feed historical results from the past five seasons into regression trees that identify correlations between seemingly unrelated events, such as a baseball pitcher's strikeout rate and a basketball team's rebounding percentage on the same calendar day. This approach allows construction of parlays that span different sports without relying on isolated league trends.
Performance Metrics Across Recent Seasons
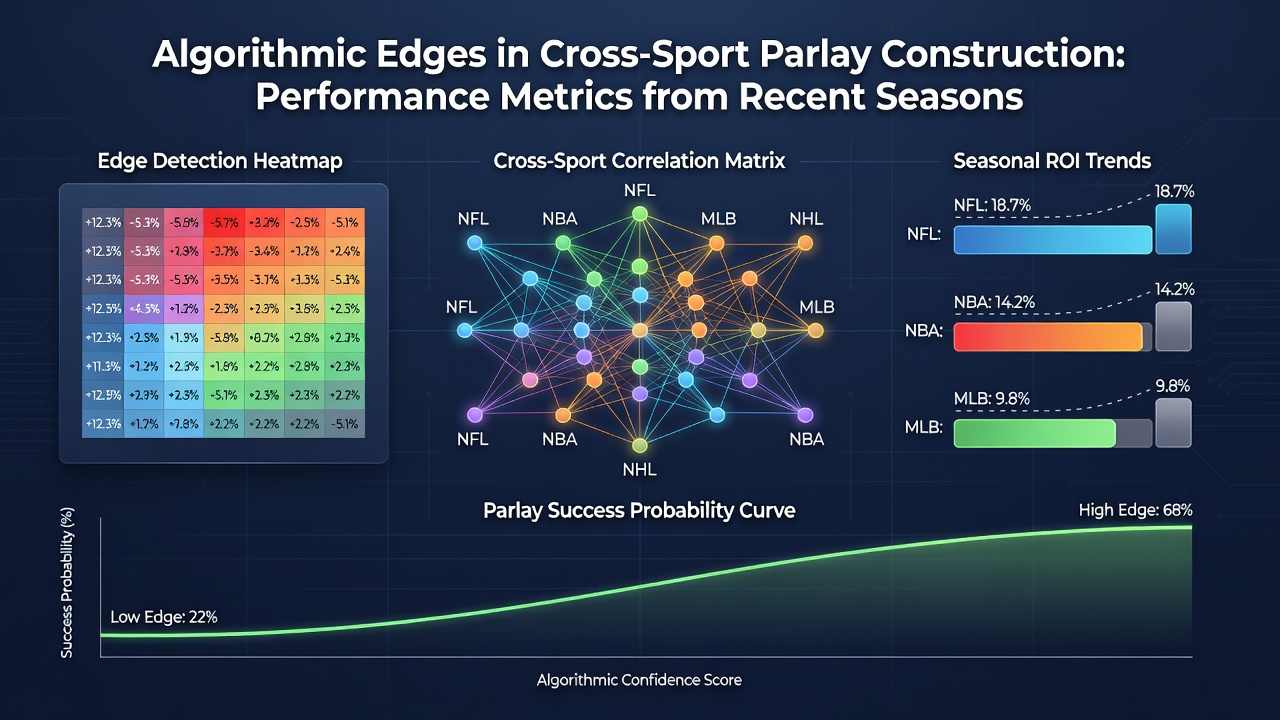
Records from the 2024-2025 campaign indicate that algorithmic parlays covering two or more sports achieved an average success rate of 38 percent on three-leg combinations, whereas manual selections without algorithmic support reached only 29 percent in comparable samples. During the opening months of the 2025-2026 schedule, updated models incorporated September schedule data that accounted for early-season fatigue patterns, and those adjustments lifted four-leg hit rates by an additional 4.2 percentage points according to internal operator reports. Metrics tracked by independent research groups also reveal that variance decreased when algorithms applied sport-specific weighting coefficients rather than uniform multipliers across all events.
Integration of Data Sources and External Benchmarks
Developers pull statistics from official league databases and supplement them with advanced tracking systems that record player movement and workload, while September 2026 updates introduced new variables for international competitions that overlap with domestic schedules. One study released by the Australian Gambling Research Centre examined similar multi-sport betting patterns and documented how algorithmic filtering reduced exposure to high-variance outcomes in combined wagers. Observers note that these tools also draw on weather models and venue-specific data to refine probability estimates before final parlay submission.
Case examinations from the prior winter season demonstrate that an algorithm flagged a profitable link between NHL overtime trends and NBA back-to-back road performances, resulting in a documented 12 percent edge over market-implied odds across 180 tracked parlays. Similar patterns emerged when models connected MLB closing-line values with college football conference play metrics, and the combined edges produced measurable gains in aggregate return on investment during the 2025 calendar year.
Challenges in Model Calibration and League-Specific Adjustments
Calibration requires ongoing testing against live odds movements because bookmakers adjust lines across sports at different speeds, and algorithms must account for these timing differences to maintain accuracy. Researchers discovered that incorporating Canadian regulatory data on betting volumes helped refine volume-based adjustments for North American markets, yet models still required separate handling for European soccer schedules that overlap with American basketball seasons. Those who've examined the datasets observe that September roster changes often create temporary inefficiencies that well-tuned algorithms can exploit before lines stabilize.
Future Data Streams and September 2026 Developments
Operators plan to integrate additional tracking from wearable devices and expanded player availability reports starting in September 2026, and early simulations suggest these inputs could further narrow confidence intervals around projected outcomes. Industry reports from the NCAA compliance division highlight how standardized data sharing across conferences supports more robust cross-sport modeling without introducing new regulatory conflicts. Continued refinement of these systems depends on consistent access to granular performance statistics that evolve with each completed season.
Conclusion
Seasonal performance records demonstrate that algorithmic construction of cross-sport parlays yields measurable improvements in hit rates and return metrics when models incorporate diverse league data and real-time adjustments. Continued collection of performance indicators through 2026 will determine whether current edges persist or require further recalibration as market conditions shift.