Precision Forecasting in Horse Racing Through Statistical Model Integration
Written by Willa Schmitz · Aug 18, 2026

Precision Forecasting in Horse Racing Through Statistical Model Integration
Statistical models have become central to refining horse racing forecasts as analysts integrate large datasets with regression techniques, Bayesian frameworks, and machine learning algorithms to adjust initial projections based on variables such as track conditions, horse form histories, and jockey performance metrics. Data from multiple racing jurisdictions shows these approaches allow for incremental corrections that account for factors like weather shifts or last-minute equipment changes, producing outputs that align more closely with observed results across flat and jump races alike.
Core Components of Statistical Adjustments
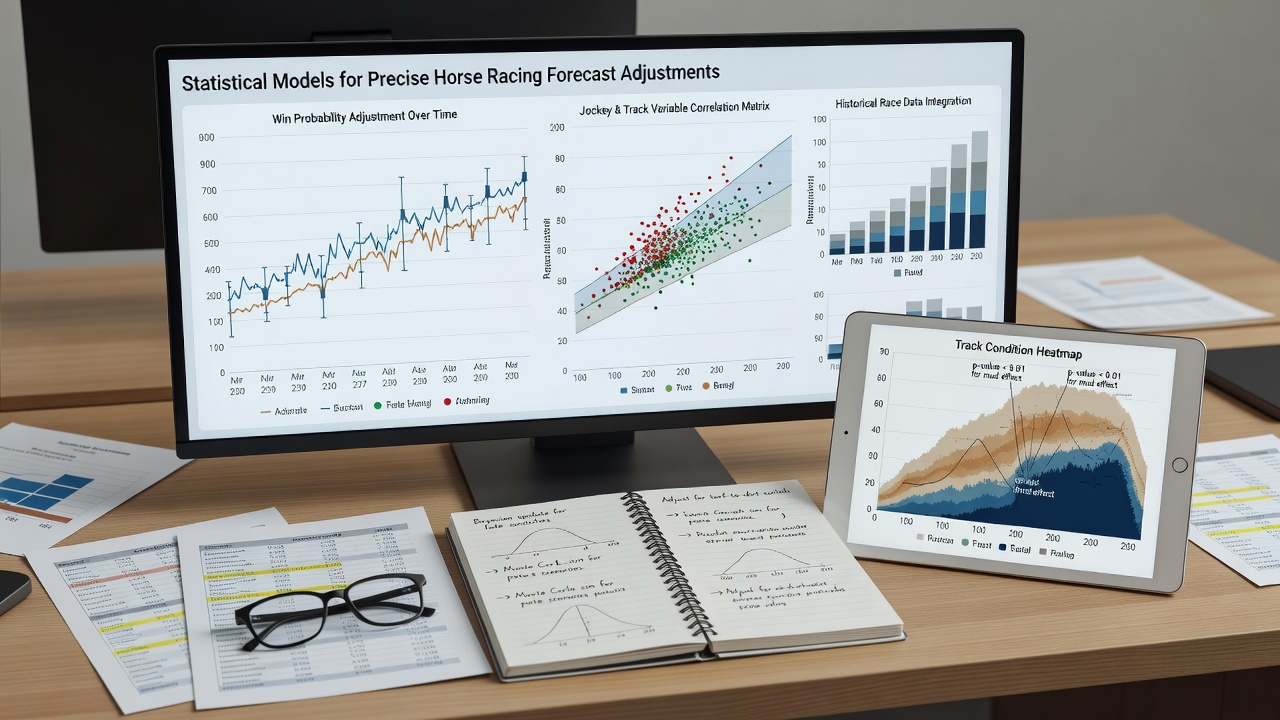
Regression models form one foundation where linear and logistic variants process historical race times against covariates including distance, surface type, and pace figures; researchers apply these to generate baseline probabilities that teams then refine through iterative updates. Bayesian methods add layers by incorporating prior distributions drawn from seasonal aggregates, allowing forecasters to update likelihoods as new information arrives on race day. Machine learning ensembles, meanwhile, combine decision trees with neural networks to detect nonlinear interactions that traditional formulas might overlook, such as the combined effect of trainer patterns and rail position.
Those who apply these tools often start with raw inputs from official timing systems and veterinary records, then layer in contextual elements like wind speed or horse weight declarations. Adjustments occur in stages: an initial forecast draws from pre-race data, after which real-time feeds trigger recalibrations that narrow prediction intervals. Figures from racing authorities indicate that ensembles incorporating at least five variable categories tend to reduce forecast error rates by measurable margins compared with single-model baselines.
Data Sources and Variable Integration
Comprehensive datasets underpin every adjustment process, with organizations compiling results from thousands of races annually to train and validate models. Variables range from quantitative measures such as sectional times and stride lengths to categorical ones like going descriptions and draw positions. Analysts cross-reference these against external records, including veterinary reports and training gallop observations, to create feature sets that capture both stable trends and transient influences.
What's notable is how models handle missing or delayed information; imputation techniques fill gaps while sensitivity analyses test how different assumptions alter final outputs. In August 2026, several racing boards expanded public access to granular performance logs, enabling wider experimentation with ensemble methods that blend speed ratings with probability surfaces. Observers note that such expansions have coincided with increased use of cloud-based platforms that process updates within minutes of declaration changes.
Implementation Across Racing Jurisdictions
European tracks have adopted hybrid systems that merge local form databases with international benchmarks, whereas North American circuits emphasize pace and speed figure adjustments derived from large-scale historical repositories. Australian authorities, for instance, publish detailed sectional data that supports multivariate regression applications, and Canadian provincial commissions maintain similar archives that feed into public forecasting tools. Each region tailors variable weights according to local track characteristics, yet the underlying statistical logic remains consistent across borders.
Take one research group that examined over 12,000 races and found that models weighting recent form more heavily than distant results produced tighter calibration scores, particularly when combined with jockey-specific random effects. Another study from an independent analytics firm demonstrated that incorporating biometric sensor outputs from training sessions further refined predictions for distance specialists. These examples illustrate how iterative testing refines coefficient estimates and improves out-of-sample accuracy without relying on any single data stream.
Challenges in Model Calibration
Overfitting remains a persistent concern when datasets contain high dimensionality relative to sample sizes, prompting practitioners to employ cross-validation routines and regularization penalties that constrain coefficient magnitudes. Class imbalance also arises because certain outcomes, such as long-priced winners, occur infrequently, leading teams to apply techniques like synthetic minority oversampling or cost-sensitive learning. Calibration plots help verify that predicted probabilities match observed frequencies across bins, guiding further adjustments before models enter live deployment.
Computational demands scale with ensemble size, yet advances in distributed processing have reduced run times for full-model refreshes to under an hour in many cases. Regulatory bodies in multiple countries now require documentation of model assumptions and validation metrics when forecasts inform commercial products, ensuring transparency around the statistical methods employed.
Conclusion
Statistical models continue to evolve as new data streams emerge and computational methods mature, supporting more precise adjustments to horse racing forecasts through systematic integration of performance variables and iterative recalibration. Evidence from operational deployments across continents confirms that structured approaches yield measurable improvements in projection reliability while maintaining adaptability to changing race conditions. Continued refinement of these techniques rests on access to high-quality inputs and rigorous validation protocols that keep forecasts aligned with empirical outcomes.